
How to Create a Report
Design insightful reports with the reports designer which uses different visualization options to process data according to a specific view.
1. Go to the “Analytics” tab and click on Reports.
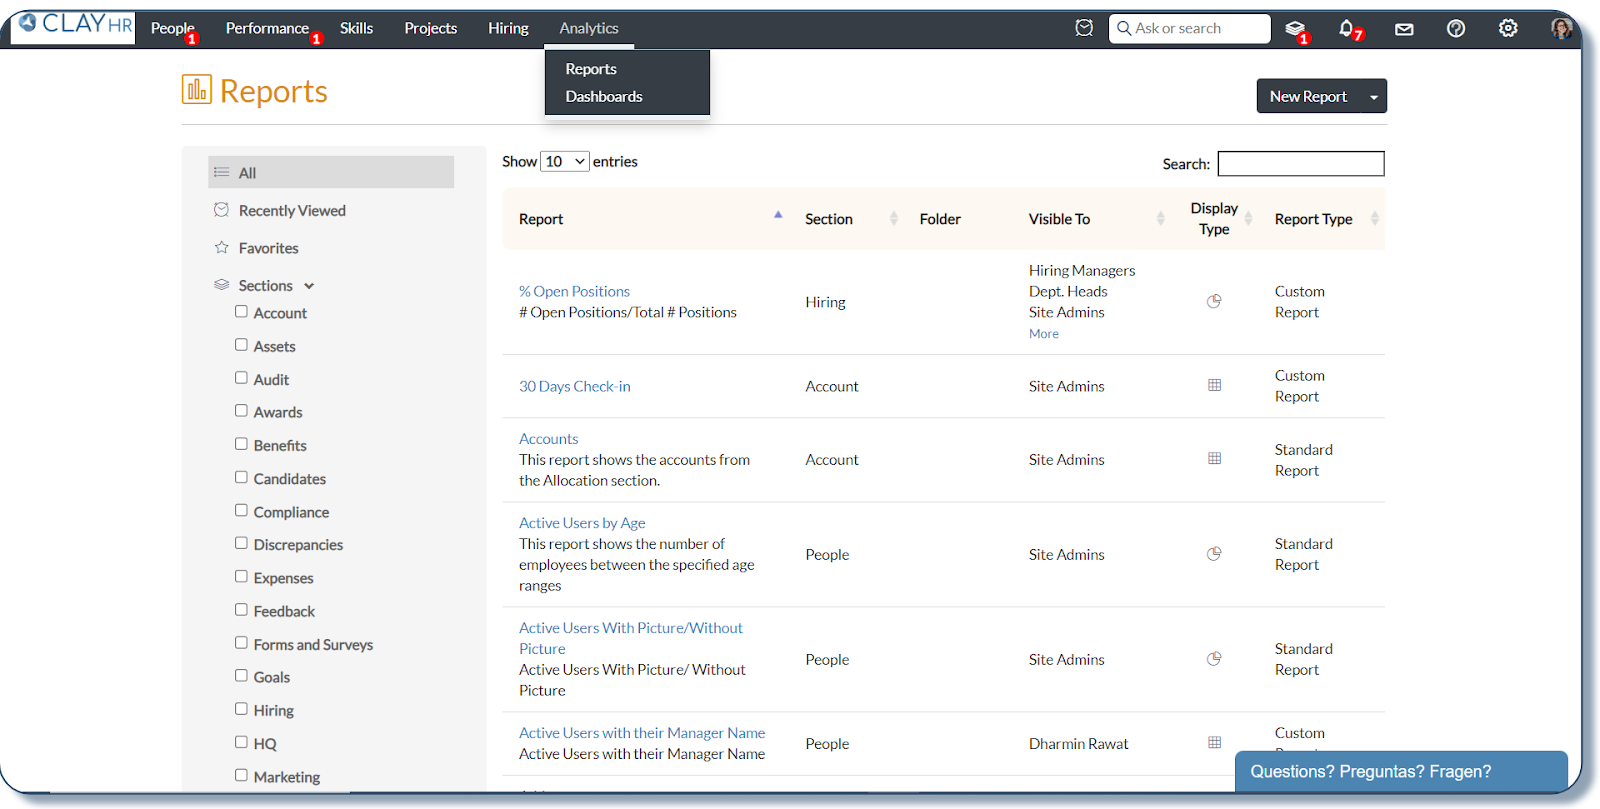
2. To create a report, click on the “New Report” button.

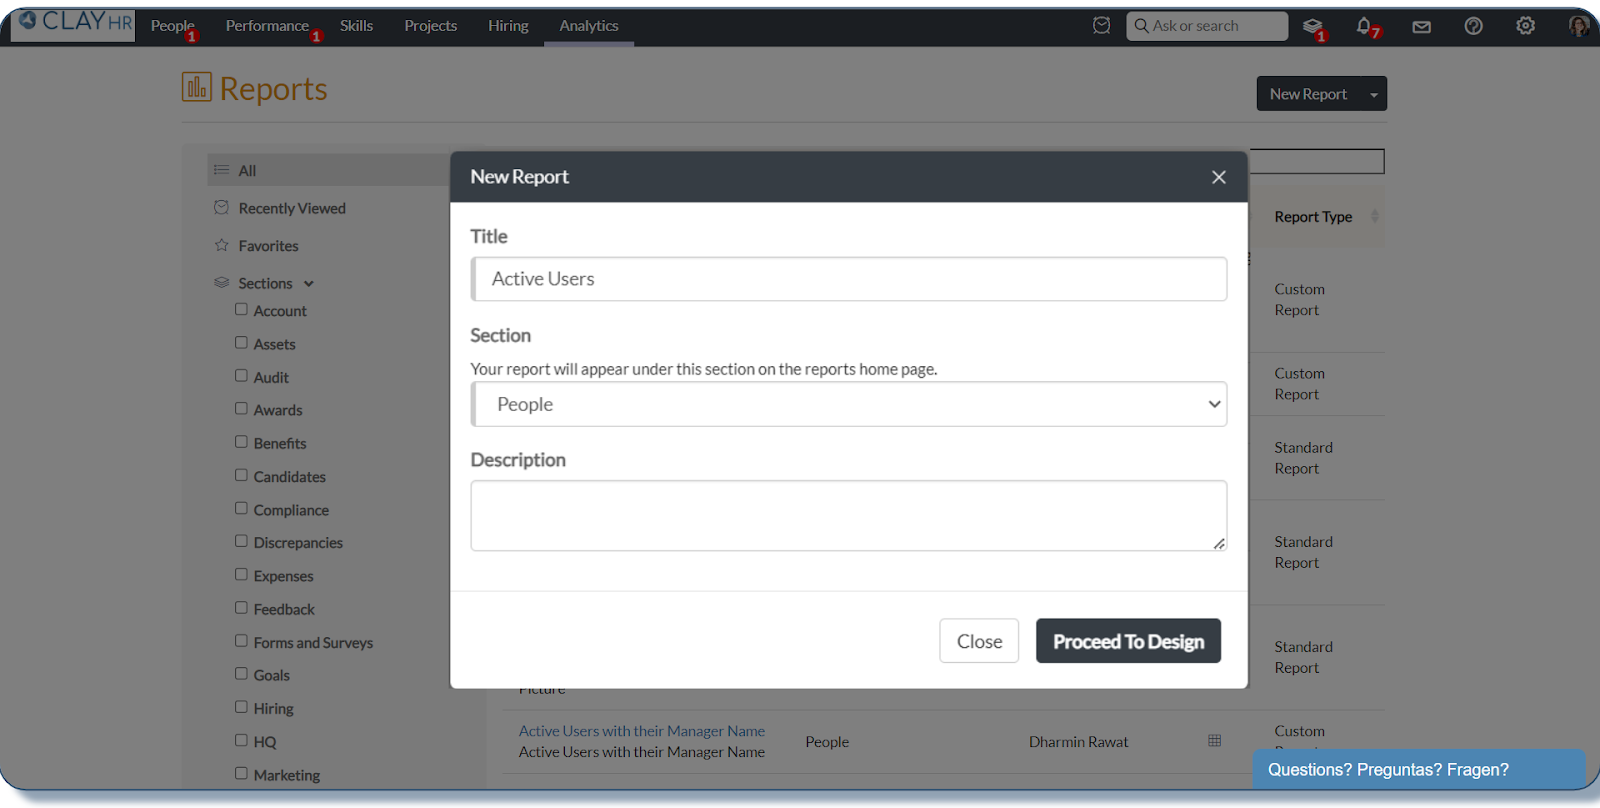
3. Fill in the details such as the Title, Section, and Description of the report, and click on “Proceed to Design”
4. On the next page, you will see a drop-down menu on the left side to select the entity on which you want to create a report. Click on the “+Add Fields” link to select the fields you want in your final report. You can also click the “+Add Data Filters” link to narrow your report.
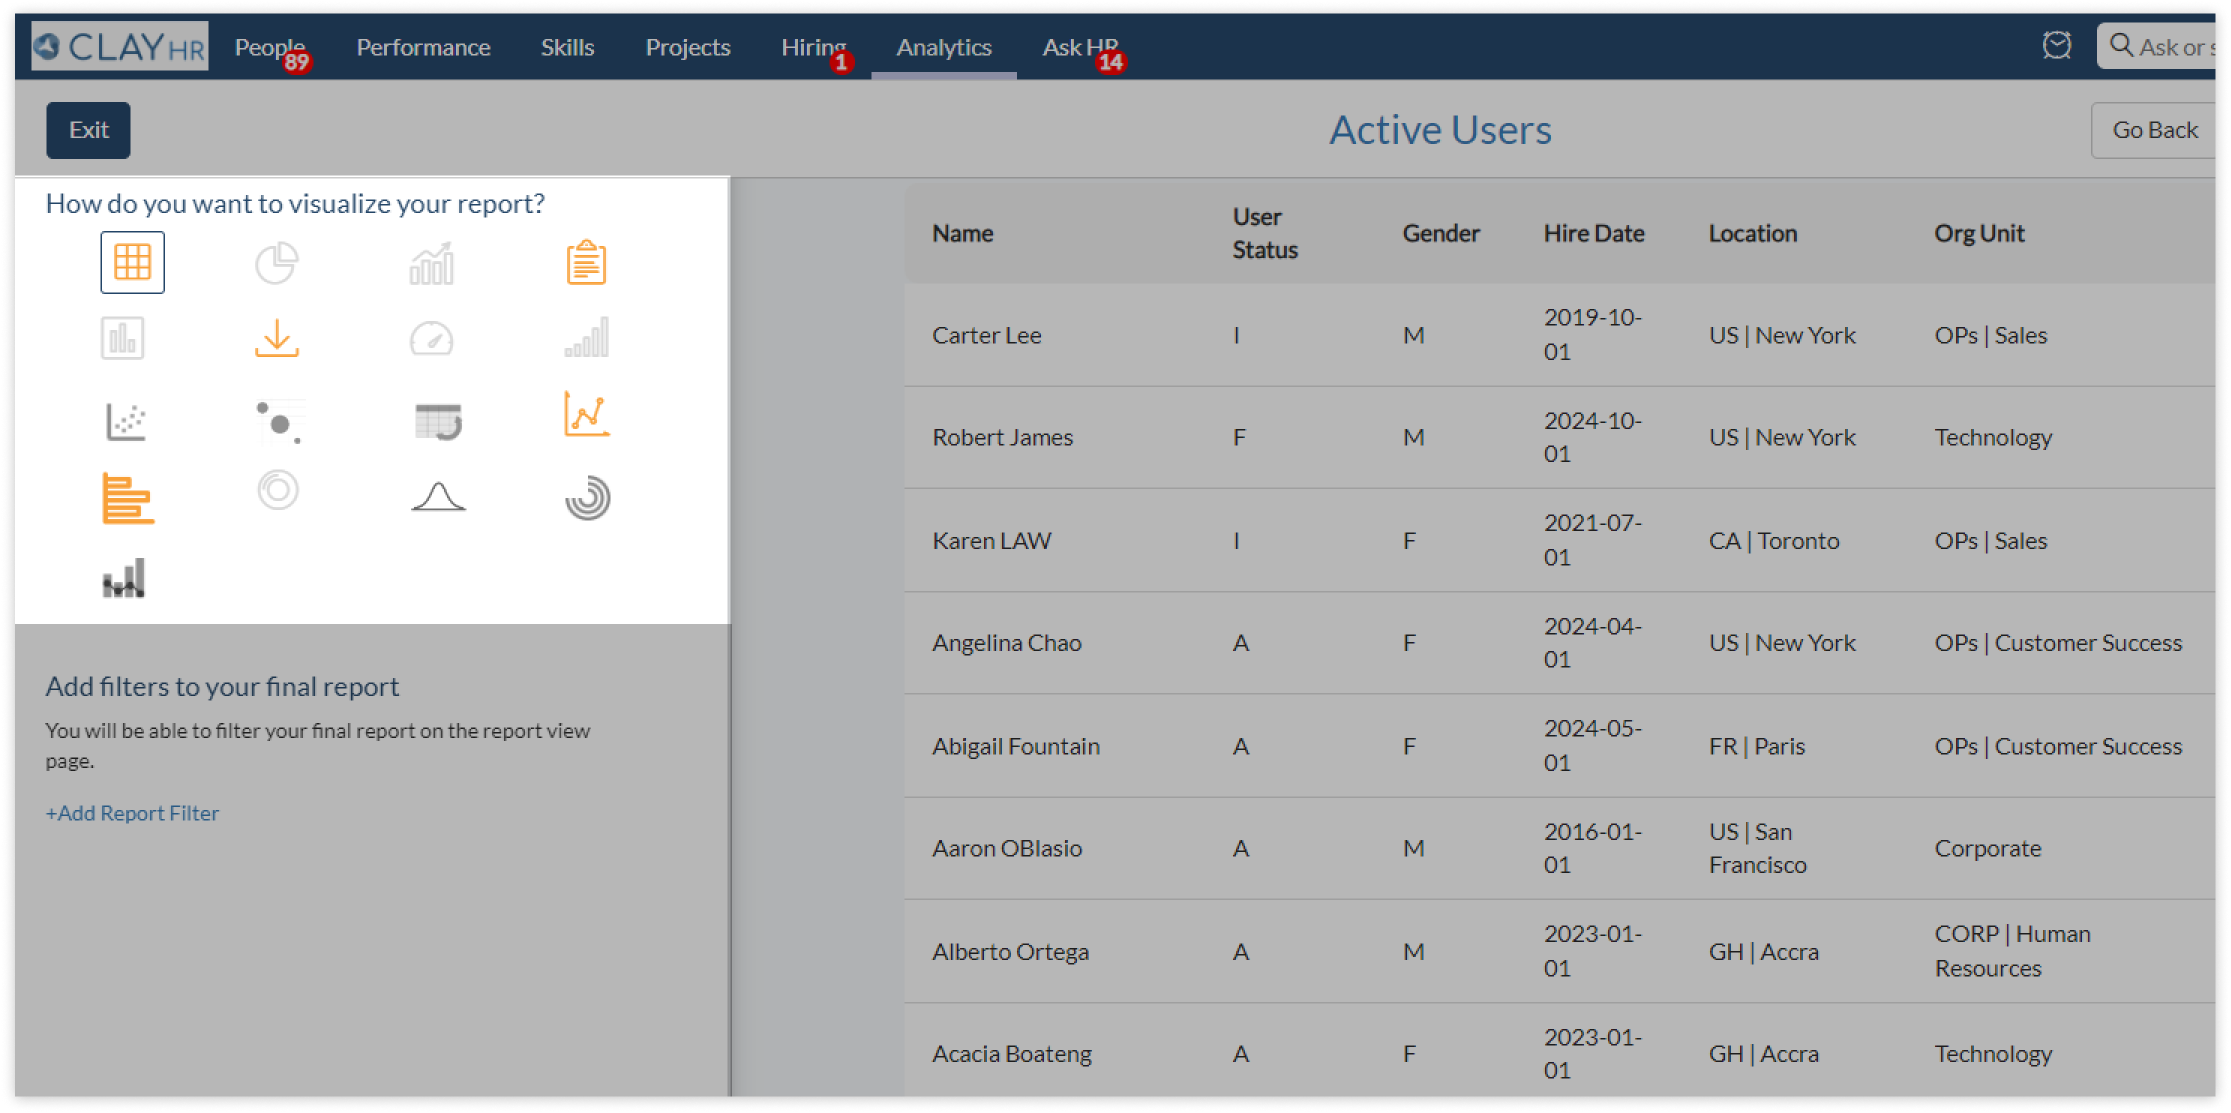
5. Click on the “Proceed to Visualization” option on the top right to select the visualization of the report.

6. On the Report Visualization page, you can choose the required visualization for the report from the visualization section. Please refer to this article to know about different visualization types.
7. You can also add report filters, user/user groups, and schedules. You can add this report to the dashboard by clicking “Add to Dashboard”.
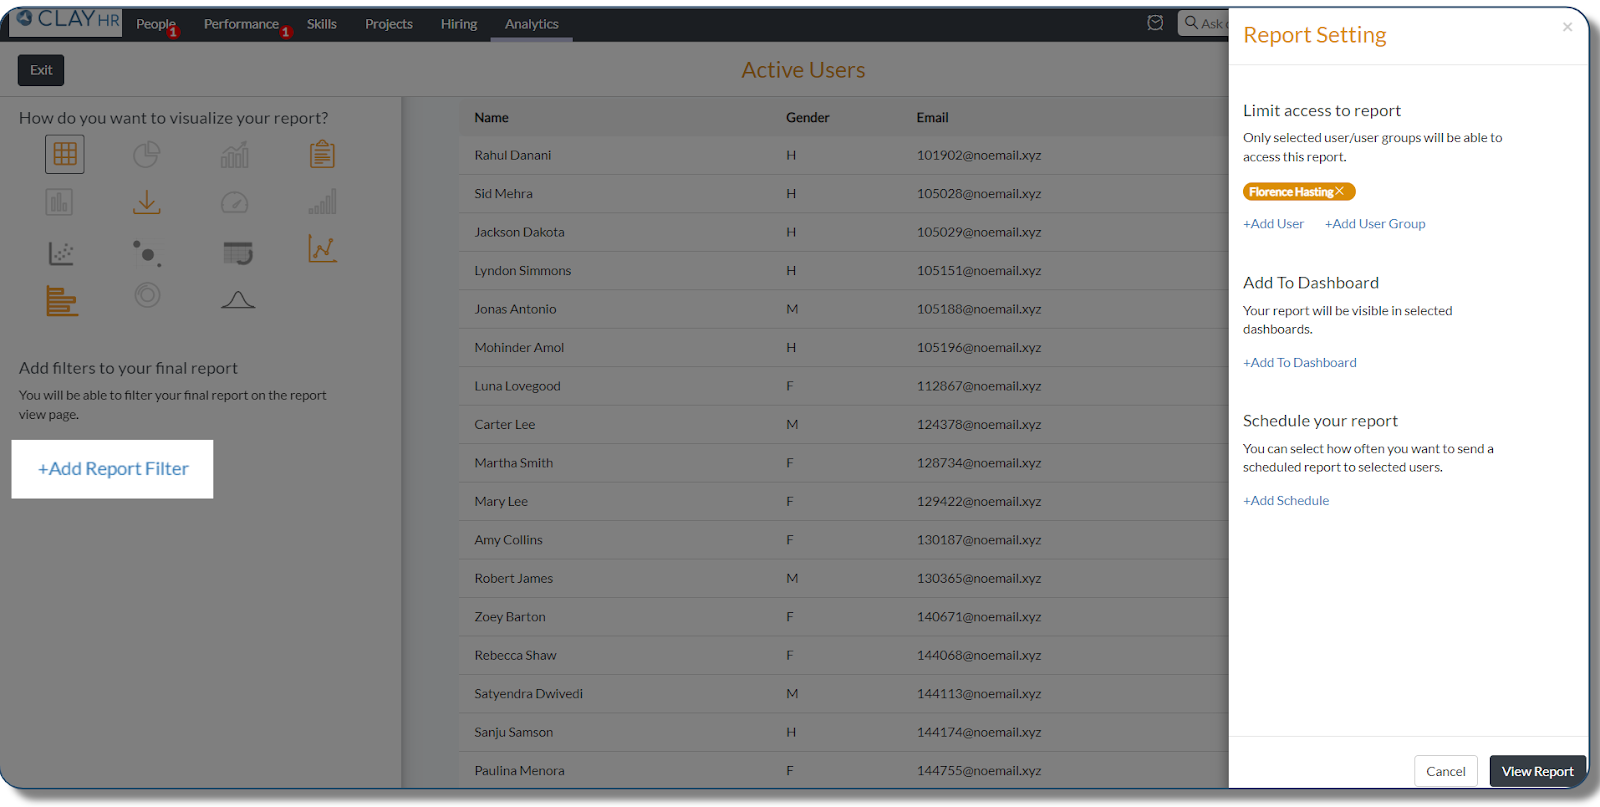
Note-
- If no access is given to any user/user group, the admin will have access only.
- If any user/user group is added, the admin will lose access. You need to add Admin discretely to give them access.
8. Click on “View Report “ to generate the report.
9. You can print the generated report or download it as CSV/ Excel. You can also edit the report by clicking on edit icon on the Report View Page.
You can create multiple reports by following the above steps.


.png)
